
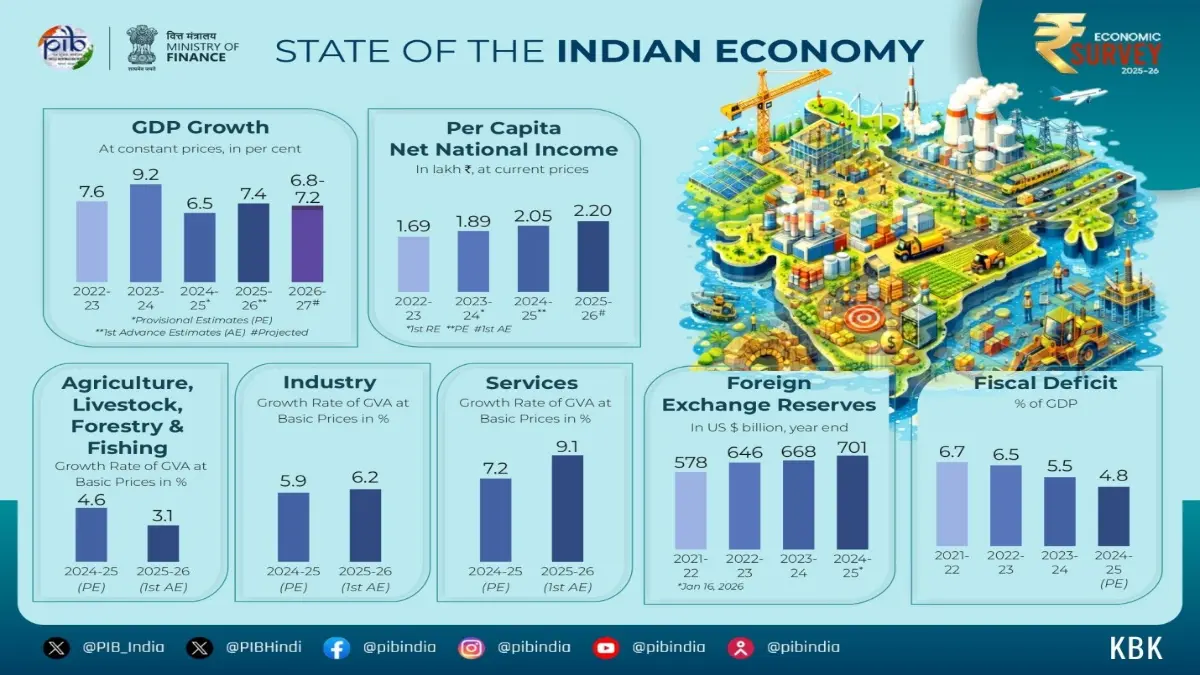
India is the fastest growing economy of the world among big countries. The India reported a 7.8% GDP growth rate for the first quarter (April–June 2026) of the 2026–27 fiscal year. This gives a positive idea about performance of the economy and the ruling party is taking the credit for this. However, the opposition has raised issues on the number amd method to reach it.This triggered an intense political and economic dispute.
One of the reasons for the controversy is the revision of base-year used for determination of GDP growth. The Ministry of Statistics and Programme Implementation (MoSPI) shifted the GDP calculation base year from 2011–12 to 2022–23. This retroactive update lowered the baseline GDP figures for previous years (including trimming Q1 2025-26 data from roughly ₹86.05 lakh crore down to ₹80.44 lakh crore
There were criticisms of comparison of presemt GDP figures with the previous estimates which were based on a different base year. Former Finance Secretary Subhash Chandra Garg and opposition leaders (such as the Indian National Congress) argued that comparing the new Q1 figure (₹88.27 lakh crore) with the unrevised older baseline yields an actual growth rate closer to 2.6%, Generally growth figures are cross checked with other related statistics. Economists like Raghuram Rajan questioned why such a high headline growth rate failed to correspond with stronger job creation or foreign direct investment, pointing to an implausibly low 2.5% GDP deflator and sluggish household consumption.
Governments take credit for high growth figures which undoubting common people fail to see in statistical perspective. The critics accuse the government of “statistical gymnastics” to artificially boost optics. Despite criticism, the Union Government, the Chief Economic Advisor V. Anantha Nageshwaran, and institutions like SBI Research dismissed the critics’ math as mixing incompatible data series. The government officials stated that base-year updates, adoption of double deflation, and the producer price index (PPI) align with UN national accounting norms. World Bank Executive Director Neelkanth Mishra defended the update as a necessary data cleanup that accurately reflects strong performance in the tertiary sector (IT, financial services, and real estate).
Growth is a very important economic indicator and generally the figure indicate economy’s good performance. But reading it in isolation may lead to incomplete understanding of the economy. The first important thing is to see which sectors were the main driving forces of growth. India’s real GVA (Gross Value Added) grew by 8.2% (and real GDP by 7.8%) in the first quarter (April–June) of FY 2026–27, according to data from the Ministry of Statistics and Programme Implementation (MOSPI). The contribution of the teriary sector was the highest at 10% followed by the secondary sector at 8.6% and primary/ agriculture sector at 2,9%. Manufacturing sector’s growth was comparatively good at .2 but agriculture sector including livestock, forestry and fishing recorded a growth rate of 3.6%.
Although unemployment figures are not enjoying consensus among observers, yet they present a mixed picture. Joblessness among young people aged 15 to 29 remains significantly higher, hovering between 13% and 16% depending on the specific monthly tracking. According to Current Weekly Status the national unemployment rate for individuals aged 15 and above is approximately 5.1%. The long-term historical rate Usual Status Unemployment on an annual basis (usual status principal plus subsidiary), remains lower at 3.1%, reflecting a steady multi-year decline from 6.0% in 2017–18, though recent monthly figures show cyclical tightening.
Despite higher growth rates, India’s global ranking in per capita income remains low. India’s Nominal GDP per Capita is estimated at approximately $2,750 to $2,818 (roughly ₹2.35–₹2.44 lakh annually). According to IMF and World Bank data India’s global rank is a around 146th to 151st out of roughly 194–195 economies. On the other hand the HDI ranking of India is also very low. India ranks 130th out of 193 countries in the Human Development Index (HDI), according to the United Nations Development Programme (UNDP). However, India’s score of 0.685 places it in the Medium Human Development category, just below the high-development threshold of 0.700). The Human Development Index (HDI) is a summary composite measure of development which evaluates quality of life across three areas: health (life expectancy at birth), education (schooling years), and standard of living (GNI per capita).
Economic inequality in India is stark, with a vast concentration of wealth and income at the very top of society alongside deep structural and regional divides. The top 1% of the population holds about 40% to 40.1% of the nation’s total wealth. The top 10% own roughly 65% of total wealth, while the bottom 50% possess only about 6.4%. The top 10% of earners capture approximately 58% of national income, whereas the bottom 50% receive about 15%. Rural incomes average roughly 40% lower than urban incomes, driven by low agricultural returns and limited local diversification. Roughly 80% to 90% of India’s workforce operates in the informal sector, lacking formal job security, social safety nets, or fixed minimum protections. Roughly 80% to 90% of India’s workforce operates in the informal sector, lacking formal job security, social safety nets, or fixed minimum. Female labor force participation is low at roughly 15% to 15.7%. Women earn significantly less than men for paid work and shoulder the vast majority of unpaid care work.
It is also important to see other macroeconomic indicators such as twin deficits (fiscal deficit plus current account deficit), debt-GDP ratio, rate of saving, capital formation and investment and inflow of foreign investment etc. to evaluate the overall health of the economy. In sum, increase in GDP growth is an important economic indicator, but it needs additional indicators to be conclusive and have a complete picture.